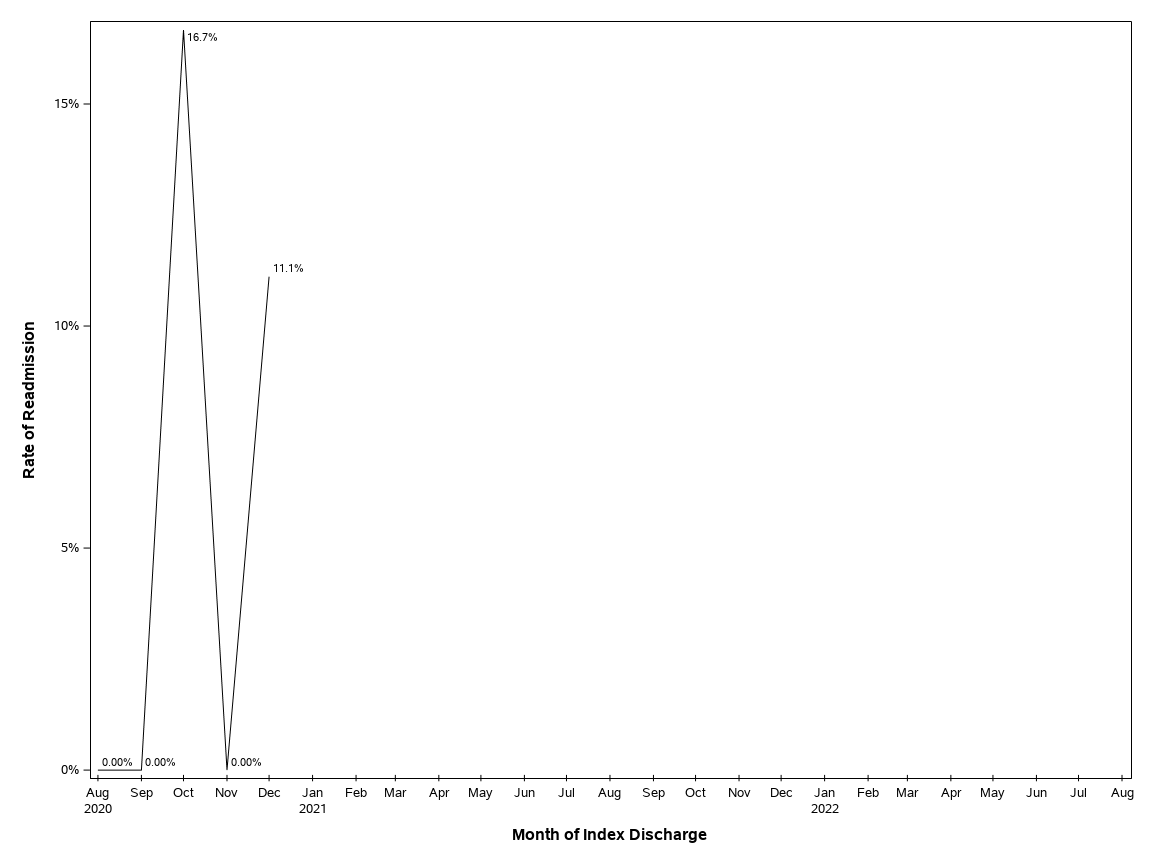
| All Cause 30-Day All Cause Readmissions |
| LLN Monthly Rates Ages 65 and older |
| All Cause 30-Day All Cause Readmissions |
| LLN Monthly Rates Ages 65 and older |
| Fiscal Year | FYTD | July | August | September | October | November | December | January | February | March | April | May | June |
|---|---|---|---|---|---|---|---|---|---|---|---|---|---|
| FY2021 | 5.71% (2/35) |
0.00% (0/5) |
0.00% (0/6) |
0.00% (0/3) |
16.7% (1/6) |
0.00% (0/6) |
11.1% (1/9) |
(0/0) |
(0/0) |
(0/0) |
(0/0) |
(0/0) |
(0/0) |
| FY2022 | (0/0) |
(0/0) |
(0/0) |
(0/0) |
(0/0) |
(0/0) |
(0/0) |
(0/0) |
(0/0) |
(0/0) |
(0/0) |
(0/0) |
(0/0) |
| FY2023 | (0/0) |
(0/0) |
(0/0) |
Twenty-Four Month Readmission Detail File - All Ages: Twenty-Four Month Readmission Detail File - All Ages |
Readmission ED High Utilization File - All Ages: Readmission ED High Utilization File - All Ages |
Dashboard Last Updated: August 15, 2022 |